
Download
M s = m t − m 0 m t × 100 % 1 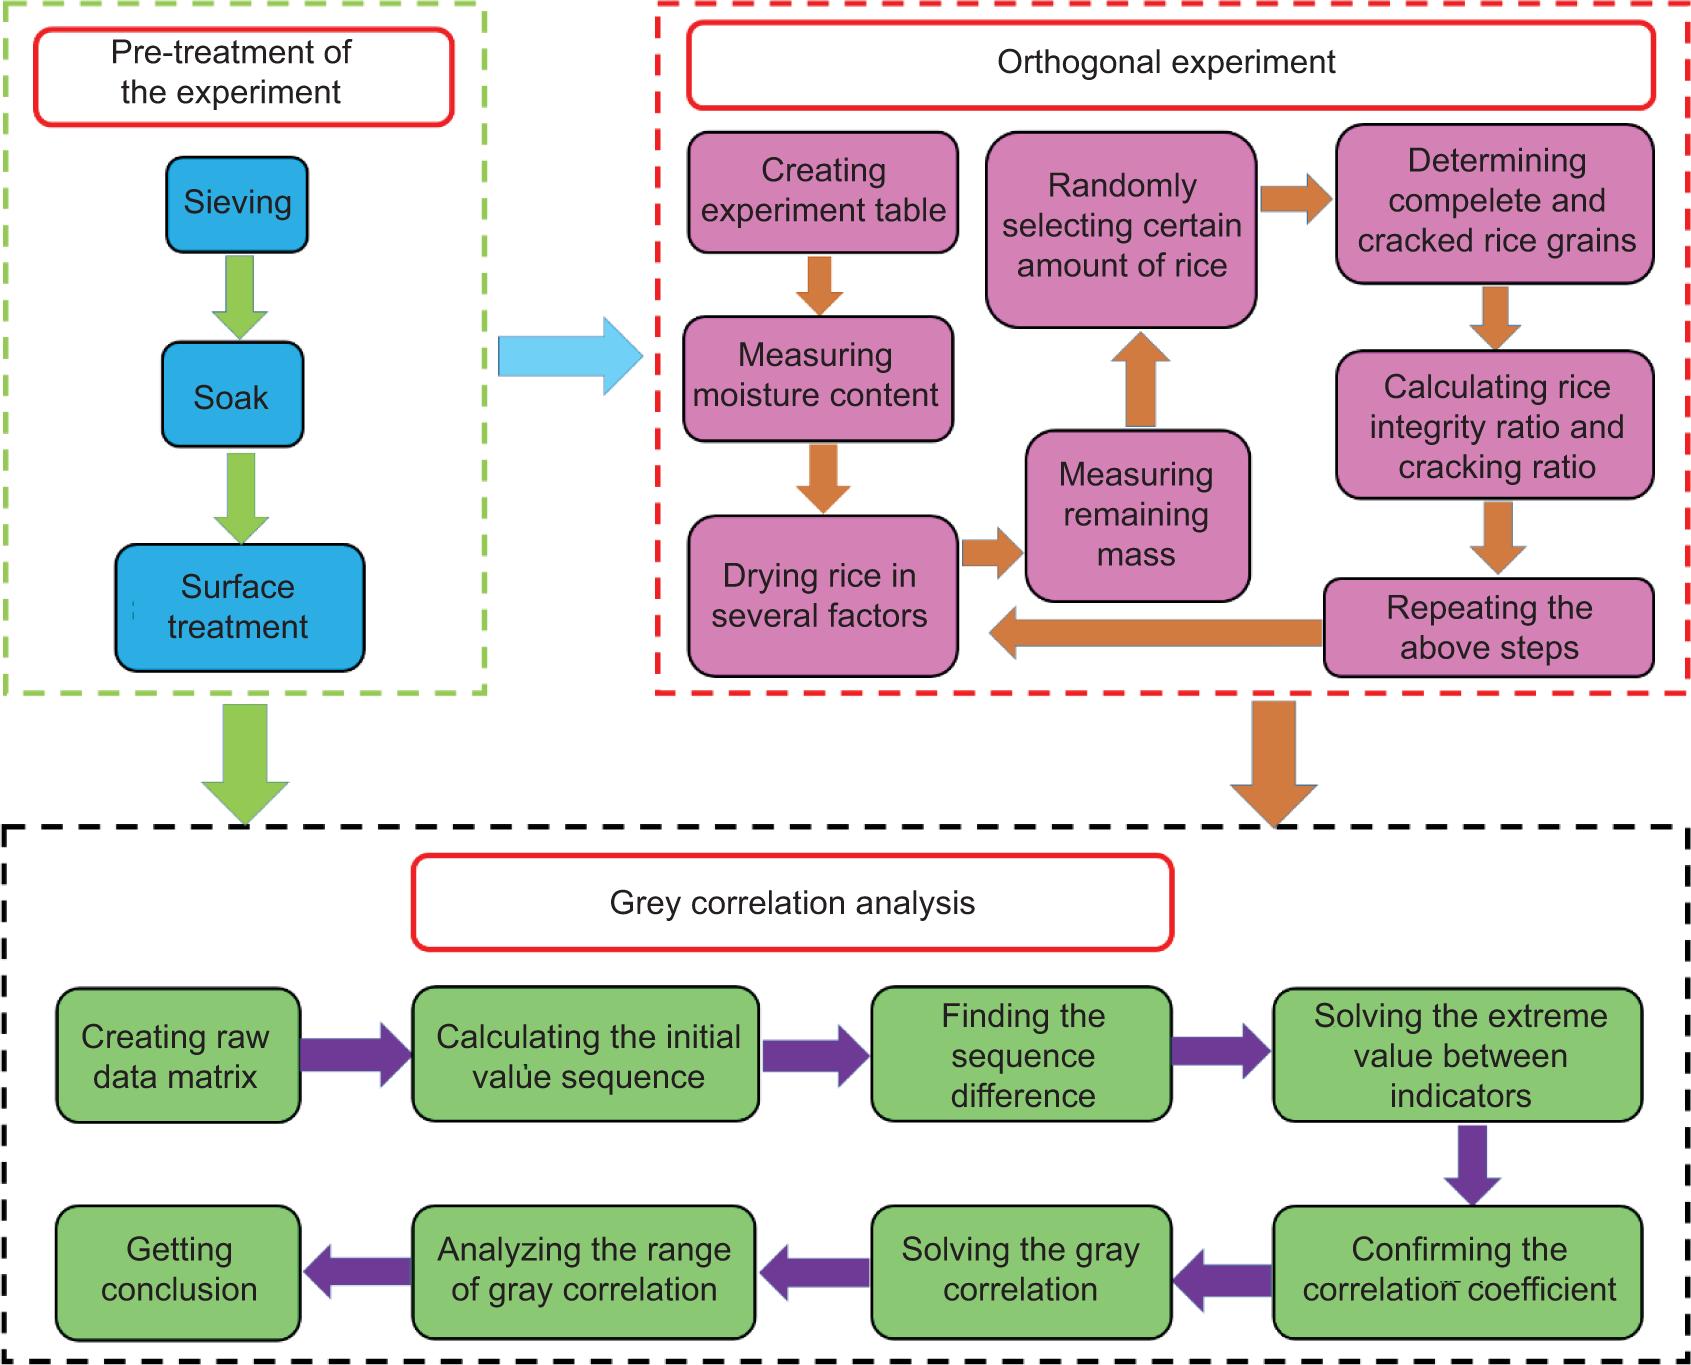
X 1 = X 1 , X 2 , … … X n ) 2 r α β = min α min β X 0 β − X α β + ρ max α max β X 0 β − X α β X 0 β − X α β + ρ max α max β X 0 β − X α β 3 r X 0 , X α = 1 n ∑ β = 1 n r α β 4
X 1 = 0.77 0.79 0.78 0.83 0.70 0.75 0.83 0.85 0.74 0.182 0.152 0.18 0.192 0.143 0.2 0.145 0.212 0.25 5 X 0 = X 01 , X 02 , … , X 0 p 6 X 0 = 0.8500 0.1430 7 X = X i j 1 X 0 i 8 X = 0.9058 0.9294 0.9176 0.9765 0.8235 0.8824 0.9765 1 0.8706 1.2727 1.0629 1.2587 1.3426 1 1.3986 1.0140 1.4825 1.7483 9 Δ α β = X 0 β − X α β 10 Δ = 0.0800 0.0600 0.0700 0.0200 0.1500 0.1000 0.0200 0 0.1100 0.0390 0.0090 0.0370 0.0460 0 0.570 0.0020 0.690 0.1070 11 M = max α max β Δ 0 , α β m = min α min β Δ 0 , α β 12 r α β = m + ρ M Δ α β + ρ M 13
r X 0 , X α = 1 9 ∑ β = 1 9 r 0 α β 14 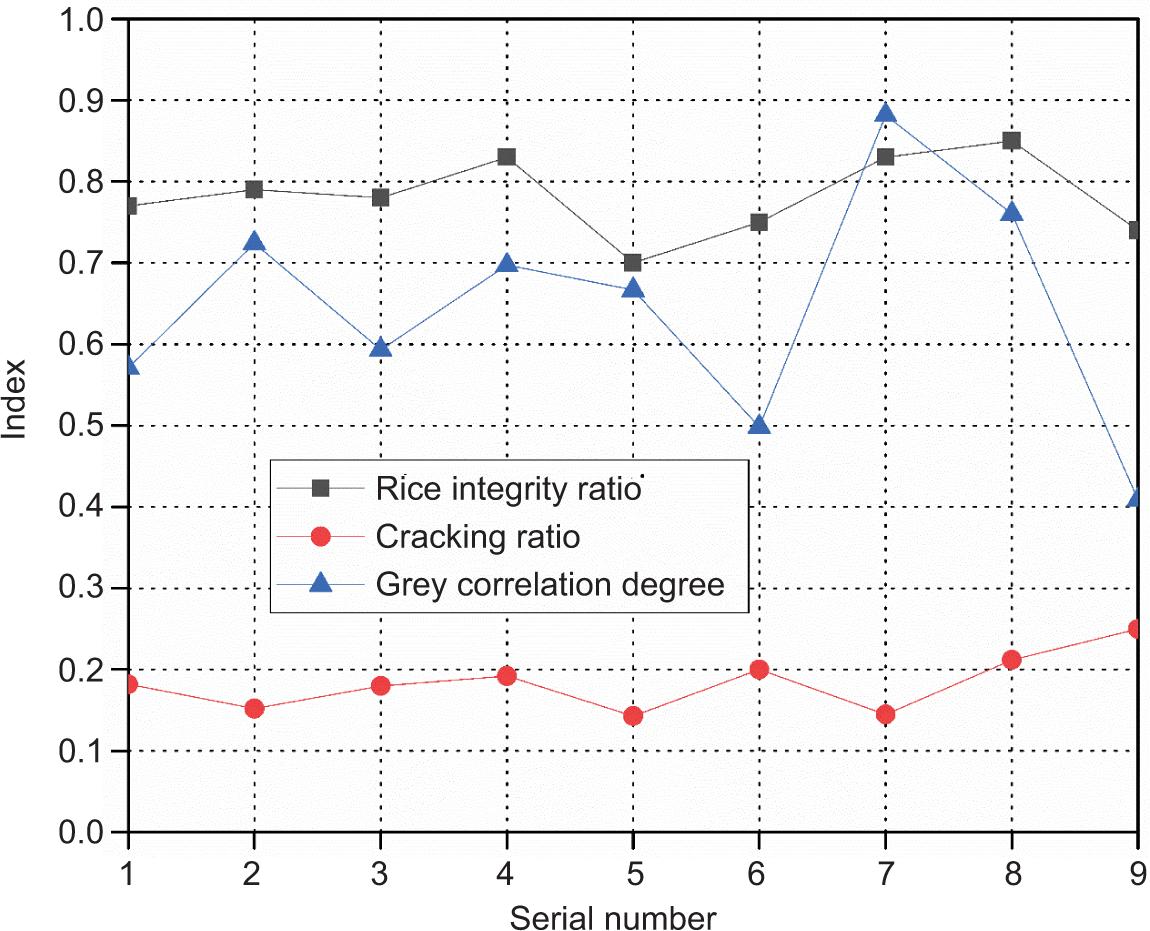
Research Article
Optimization method of microwave drying process parameters for rice
Tongsheng Sun*, Fangqing Ling
School of Mechanical Engineering, Anhui Polytechnic University, Wuhu, People’s Republic of China
Abstract
In this work, the optimal process to improve the efficiency of microwave drying of rice is studied. The optimal conditions for reducing the crack rate and improving the head rice rate are analyzed according to the principle of the orthogonal experiment. The optimization method of the rice microwave drying process parameters is proposed to simultaneously consider the two indicators, namely, crack and head rice rates, based on the grey system theory. The grey correlation degree analysis is carried out on the process conditions of the microwave drying rice. The result shows that the main factor affecting the integrity rate of the rice grain is the vacuum degree, and the main factor affecting the crack rate is the loading thickness. The grey correlation degree curve of head rice and crack rate fluctuates greatly, and the correlation between the two indexes is high. According to the grey correlation degree, the optimal parameters are microwave power of 500 W, vacuum degree of 0.02 MPa, and loading thickness of 0.027 m. The head rice and crack rate are both optimized when drying under the parameters. The results provide a guiding method for the study of the correlation degree between drying indexes and provide a method basis for the further selection of the best drying process.
Key words: crack rate of rice, grey correlation degree, head rice rate, microwave drying, orthogonal experiment
*Corresponding author: Tongsheng Sun, PhD, Professor, School of Mechanical Engineering, Anhui Polytechnic University, Wuhu 241000, People’s Republic of China. Email: [email protected]
Submitted: 8 May 2021; Accepted: 8 July 2021; Published: 28 July 2021
© 2021 Codon Publications
This is an Open Access article distributed under the terms of the Creative Commons Attribution-NonCommercial-ShareAlike 4.0 International (CC BY-NC-SA 4.0). License (http://creativecommons.org/licenses/by-nc-sa/4.0/)
Introduction
After harvest, the rice may have high moisture content and high activity and still maintains strong respiration. Under the respiration, the rice itself may produce a substantial amount of carbon dioxide and heat, thereby sharply increasing the temperature while consuming considerable nutrients. When the temperature reaches a critical point and is in a suitable temperature range, harmful bacteria in the rice may multiply in large numbers, accordingly the rice may deteriorate and rot in a short period of time (Luo et al., 2020; Zhang et al., 2019). Rice needs to be fully dried before storage to avoid these problems. Traditional drying methods, such as flame, hot air, steam, and electric heating, are for external heating and drying. When the heat is absorbed by the surface of the material, it may penetrate the interior through heat conduction, and the heating and drying may be realized. However, microwave drying is a method of internal heating. This approach has the advantages of fast drying rate, uniform temperature distribution, cleanliness, and high product quality (Khan et al., 2020) and overcomes the uneven heating of the medium, low efficiency, high consumption, and other disadvantages caused by traditional drying methods. Compared with traditional drying methods, microwave drying slow down the deterioration of texture quality and gelatinization characteristics of rice, and reduces the consumption of nutrients such as starch during storage (Yuan et al., 2018). Microwave drying technology has been gradually applied to the processing of agricultural products.
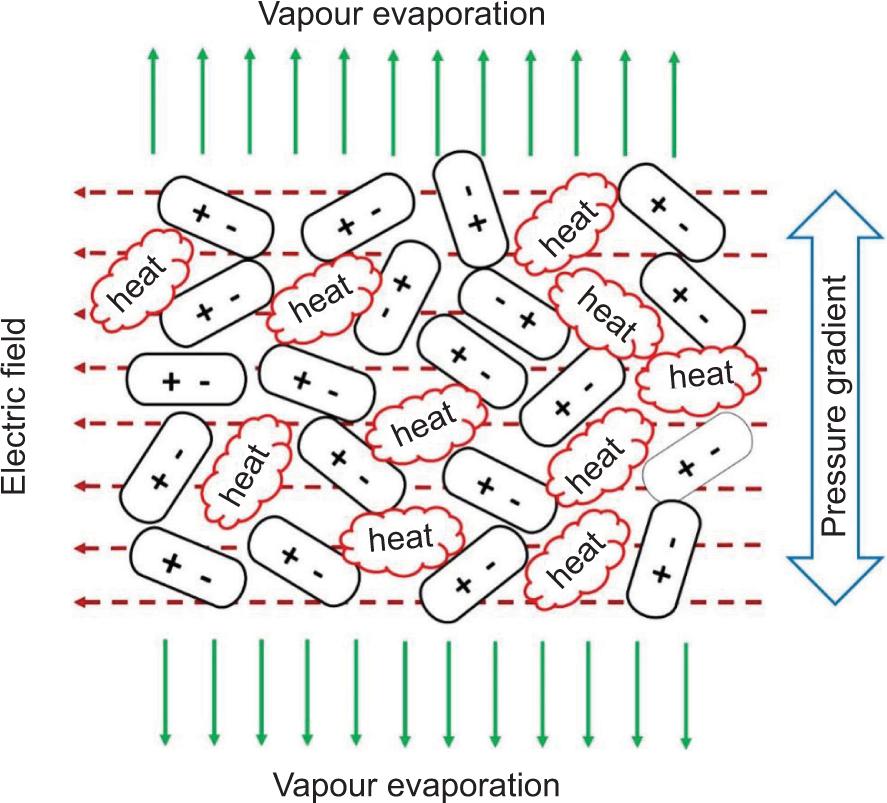
During microwave drying of rice, the molecules are in a microwave electric field with a short oscillation period and a high frequency. Polarization occurs, and the molecules are neatly arranged along the direction of the microwave electric field. The molecules rotate as the direction of the alternating microwave high-frequency electric field changes. These molecules produce violent collisions and frictions. Part of the microwave energy is converted into molecular kinetic energy and expressed in the form of heat (Figure 1), thereby resulting in the sharp increase of the water vapor pressure in the rice. Under the pressure, the water in the rice is gradually evaporated to dry the rice (Zheng et al., 2018).
Figure 1. Principle of microwave drying of rice.
Research on the microwave drying process of some agricultural products has been carried out worldwide. Yang et al. (2016) conducted orthogonal experiments on cassia leaf oil by using ultrasonic-microwave drying equipment. Jahanbakhshi et al. (2020) found the kinetics and quality properties of pistachios under different microwave powers and ultrasound (US) pretreatment at different times. They obtained the optimal process conditions for extracting cassia leaf oil from ultrasonic-microwave drying. Song and Wang (2020) performed microwave drying of the purple potato chips, discussed the drying characteristics under different process conditions, and proposed a drying kinetic model. Taheri et al. (2020) used microwave fluidized bed dryers to dry and disinfect the seeds of red lentils and studied their microwave drying kinetics. Abbaspour-Gilandeh et al. (2019) investigated the drying kinetics of walnuts including specific energy consumption, shrinkage, and walnut kernels’ color in the ultrasonic microwave. Barreto et al. (2019) studied the use of continuous cycle microwave vacuum pulse heating to produce oil-free potato snacks and evaluated the drying kinetics and product physical properties. The technology of microwave drying of rice was optimized by orthogonal experiment, and the influence degree of different factors was studied. Moreover, this work analyzes the experiment with grey correlation theory and studies the influence of each influencing factor on microwave drying of rice and optimal process conditions.
Materials and Methods
Experimental method
Rice with full and no empty husk from the same species and region was used as the experimental material. Specific initial moisture content of 25% (error must not exceed 2%) of rice was obtained by soaking before the experiment. The experimental equipment includes a microwave vacuum drying oven, an electronic analytical balance, a capacitive grain moisture meter, and a rice huller.
The moisture content of rice needs to be calculated in the drying experiment. The moisture of rice is shown as dry-based and wet-based moisture. In this study, wet-based moisture is used as moisture content. Wet-based moisture is divided into the ratio of moisture mass in rice to total rice mass (Jiang et al., 2019; Li et al., 2018b; Zhou et al., 2019):
where, Ms is the moisture content of wet-based rice, mt is the quality of rice at the drying time t, and m0 is the quality of the dry matter in rice.
About a hundred grains of rice were randomly selected from dried rice, and the head rice rate was calculated by counting the complete number of shelled rice grains, and the crack rate was calculated by observing the number of cracks on the surface of the fine rice grains.
Experimental equipment includes microwave vacuum drying oven, electronic analytical balance, capacitive grain moisture meter, and huller. A microwave vacuum drying oven is used for drying rice in the orthogonal experiment. An electronic analytical balance is used to weigh the quality of rice. A capacitive grain moisture meter is used to measure the initial moisture content of rice. A huller is used for hulling the selected rice.
The microwave drying experimental analytical process (Figure 2) includes preprocessing, orthogonal experiments, and grey correlation analyses.
Figure 2. The experimental analytical process of microwave drying.
Orthogonal experiment
An orthogonal experiment is an experimental method to study the multifactor level, and it is based on orthogonality from the comprehensive test to select parts with uniform dispersion and symmetrical comparability characteristics for experiments; then, a line chart is drawn according to the results, and conclusions will be correspondingly obtained (Li et al., 2018a; Liu et al., 2018; Yang et al., 2016).
With the index of the percentage of head rice and brown rice crack rate, the orthogonal table L9(34) was used, and three levels were selected for the experiment (Deng et al., 2018; Tang et al., 2019). The settings of factors and levels are shown in Table 1. Microwave power refers to the power of the microwave during rice drying. Vacuum degree refers to the pressure inside the chamber when the rice is dried. Loading thickness refers to the thickness of rice in the drying container.
Table 1. Orthogonal experimental factors and levels.
| Level | Factor | ||
|---|---|---|---|
| Microwave power (W) | Vacuum degree (MPa) | Loading thickness (m) | |
| 1 | 300 | 0.02 | 0.015 |
| 2 | 400 | 0.04 | 0.027 |
| 3 | 500 | 0.06 | 0.038 |
The initial moisture content of rice was measured by a capacitive grain moisture meter before each experiment. The influencing factors were controlled according to the orthogonal experimental table, and the rice was dried in a microwave vacuum drying oven. The rice was weighed after drying. Some grains were randomly selected from the rice and hulled with a rice huller. Thereafter, the rice grains were observed and analyzed, and the head rice and crack rates were calculated. The experimental steps were repeated according to the orthogonal experimental table.
Grey correlation analysis
The original data matrix and initial value sequence of the head rice and crack rates are established according to the data obtained from the orthogonal experiment. The sequence difference and extreme difference between the indicators are calculated. The grey correlation coefficient and grey correlation are calculated and drawn into a line chart. The correlation between the head rice and crack rates is determined, the extreme difference analysis is carried out, and the optimal process parameters are further obtained from it.
The grey system refers to a system with some unknown information, which can be further elaborated by grey variables (Xie and Chen, 2018; Xie and Xin, 2014). The grey correlation analytical method is part of the grey system theory, and the grey correlation is the measure of the size of the association between different things and indicators (Shinde Anil and Pawar Prashant, 2017; Sun et al., 2018). This method quantitatively describes the mutual influence and change between things and indicators (i.e., the size, direction, and speed of change). If the changes between things are same as those between indicators, then they are more correlated; otherwise, they are less correlated (Ding et al., 2018). In this study, the two indicators, namely, head rice and crack rates are calculated to determine the correlation between them. The similarity between the curves of the head rice rate and the crack rate is used to determine whether the two are closely related according to the central idea of the grey correlation analytical method. The correlation of the corresponding indicator is great when the two curves are close, and vice versa. The grey correlation analytical method is as follows.
We set the series of the system to be (Pagar and Gawande, 2020):
where, n is the number of experiments of microwave drying of rice; and X(1), …, X(n) is the series of head rice and crack rates after each microwave drying experiment.
The correlation coefficient between the head rice and the crack rates is as follows (Gao et al., 2018; Sun et al., 2018):
The grey correlation degree between the head rice and the crack rates is as follows (Zhang et al., 2018):
Results and Discussion
Orthogonal experiment
Nine samples and conduct microwave drying experiments were prepared according to Table 1. The initial moisture content of each group of rice samples was controlled at 25% ± 2%. We control the influencing factors according to the orthogonal table used in Table 2 and put the rice into the microwave vacuum drying oven to dry for 8 min. Thereafter, we remove the rice and sufficiently cool it before weighing. We randomly select 100 grains of rice. The grains were hulled with a rice huller. The head rice and crack rates were calculated, and they were analyzed as inspection indicators. The results of the experiment are shown in Table 2.
Table 2. L9(34) Orthogonal table and experimental results.
| Serial no. | Microwave power (W) | Vacuum degree (MPa) | Loading thickness (m) | Head rice rate | Crack rate |
|---|---|---|---|---|---|
| 1 | 300 | 0.02 | 0.015 | 77% | 18.20% |
| 2 | 300 | 0.04 | 0.027 | 79% | 15.20% |
| 3 | 300 | 0.06 | 0.038 | 78% | 18% |
| 4 | 400 | 0.02 | 0.027 | 83% | 19.20% |
| 5 | 400 | 0.04 | 0.038 | 70% | 14.30% |
| 6 | 400 | 0.06 | 0.015 | 75% | 20% |
| 7 | 500 | 0.02 | 0.038 | 83% | 14.50% |
| 8 | 500 | 0.04 | 0.015 | 85% | 21.20% |
| 9 | 500 | 0.06 | 0.027 | 74% | 25% |
Analysis of the crack rate results
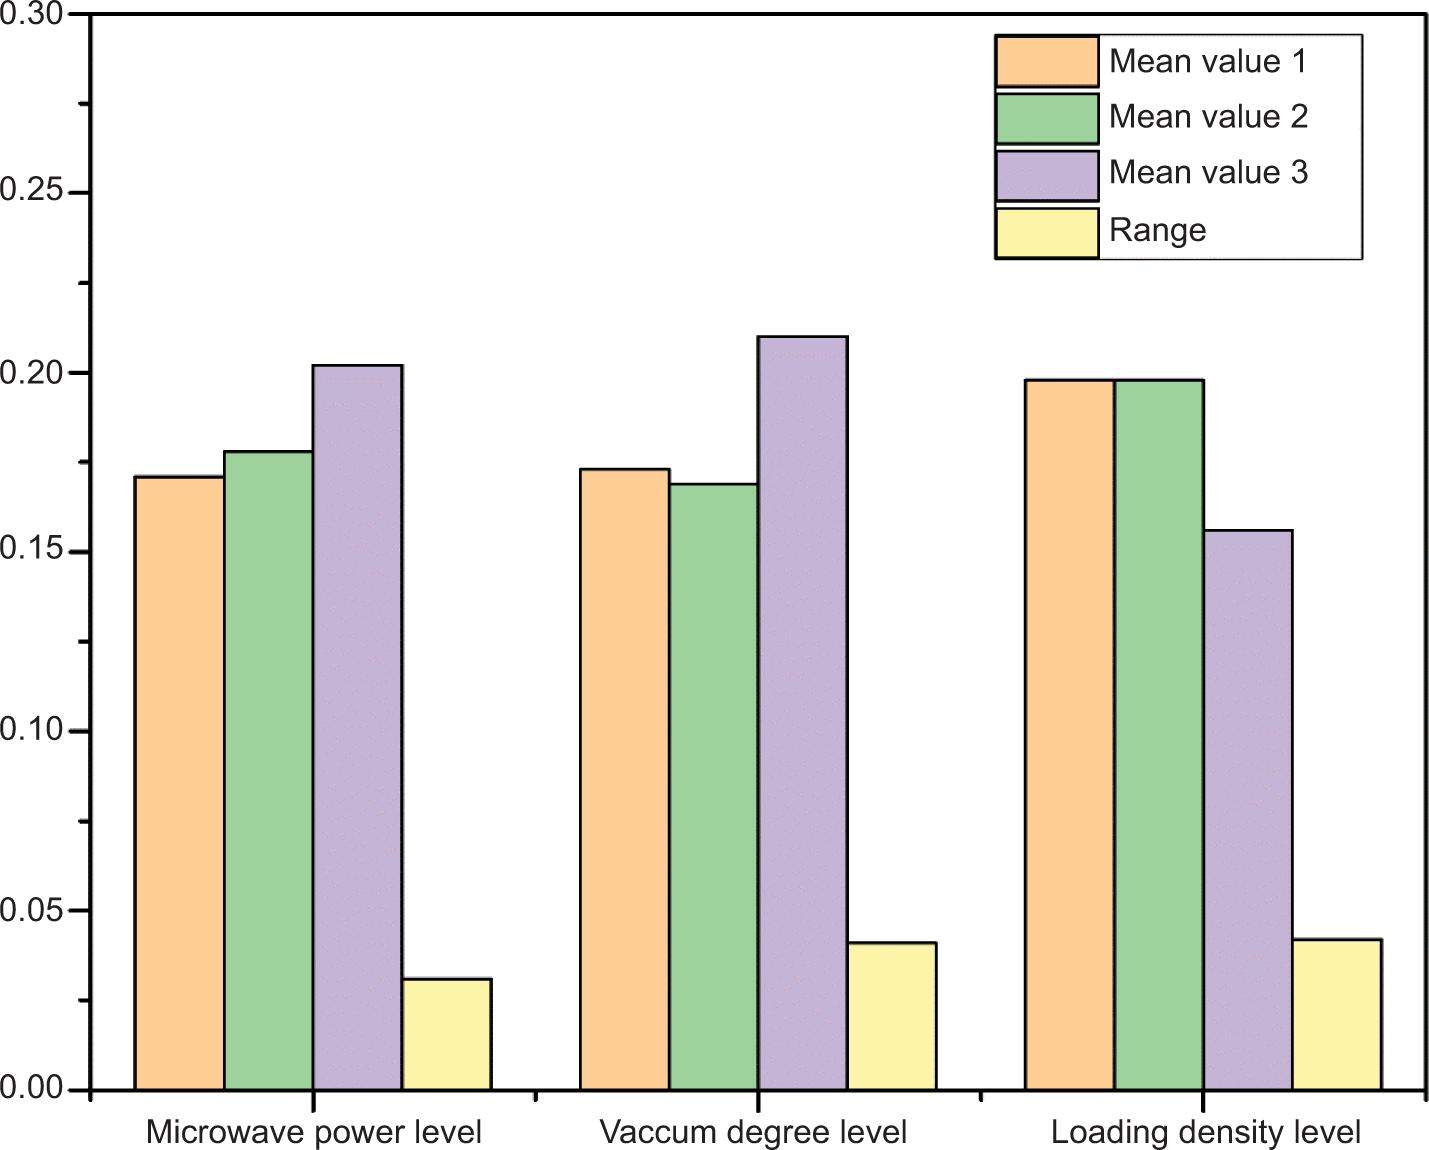
The mean value and range of the crack rate are calculated according to the orthogonal experimental results shown in Table 2 (Deng et al., 2018; Guo et al., 2017). The calculated data are shown in Table 3, and the histogram is plotted as shown in Figure 3. Table 3 and Figure 3 demonstrate that the range of crack rate at the loading thickness level is equal to 0.042, at the vacuum level is equal to 0.041, and at the microwave power level is equal to 0.031. The loading thickness and vacuum degree have a great influence on the crack rate of the microwave drying rice. The crack rate of rice under the influence of vacuum degree fluctuates from 17.3% to 21%. Meanwhile, the crack rate of rice under the influence of the loading thickness fluctuates from 15.6% to 19.8%. The fluctuation range of crack rate is approximately 4% under both factors. The microwave power has the least effect on the rice crack rate, which fluctuates from 17.1% and 20.2%. Specifically, the loading thickness and vacuum degree have a great impact on the crack rate. A low crack rate is good to maintain the optimal quality of rice. Thus, the optimal conditions for microwave drying rice are as follows: the microwave power is 300 W, the vacuum degree is 0.02 MPa, and the loading thickness is 0.038 m.
Table 3. Orthogonal experimental analysis of the crack rate.
| Serial no. | Microwave power level | Vacuum degree level | Loading density level | Crack rate |
|---|---|---|---|---|
| 1 | 1 | 1 | 1 | 18.20% |
| 2 | 1 | 2 | 2 | 15.20% |
| 3 | 1 | 3 | 3 | 18% |
| 4 | 2 | 1 | 2 | 19.20% |
| 5 | 2 | 2 | 3 | 14.30% |
| 6 | 2 | 3 | 1 | 20% |
| 7 | 3 | 1 | 3 | 14.50% |
| 8 | 3 | 2 | 1 | 21.20% |
| 9 | 3 | 3 | 2 | 25% |
| Mean value 1 | 0.171 | 0.173 | 0.198 | |
| Mean value 2 | 0.178 | 0.169 | 0.198 | |
| Mean value 3 | 0.202 | 0.210 | 0.156 | |
| Range | 0.031 | 0.041 | 0.042 |
Figure 3. Columnar analysis of the crack rate.
The variance calculation of the crack rate is carried out according to the results of the orthogonal experiments (Deng et al., 2018; Guo et al., 2017), and the analytical data are shown in Table 4. The quadratic sum of crack rate deviation under varying microwave power values is 0.002, that under different vacuum degrees is 0.003, and that under diverse loading thicknesses is 0.004. This finding shows that the order of the influencing degree of different factors on the crack rate is as follows: loading thickness>vacuum degree>microwave power. The result is consistent with the range analysis.
Table 4. Crack rate variance analysis.
| Factor | Quadratic sum of the deviation | Degrees of freedom | F ratio | F thresholds |
|---|---|---|---|---|
| Microwave power | 0.002 | 2 | 0.667 | 5.140 |
| Vacuum degree | 0.003 | 2 | 1.000 | 5.140 |
| Loading density | 0.004 | 2 | 1.333 | 5.140 |
| Error | 0.01 | 6 |
Analysis of the head rice rate
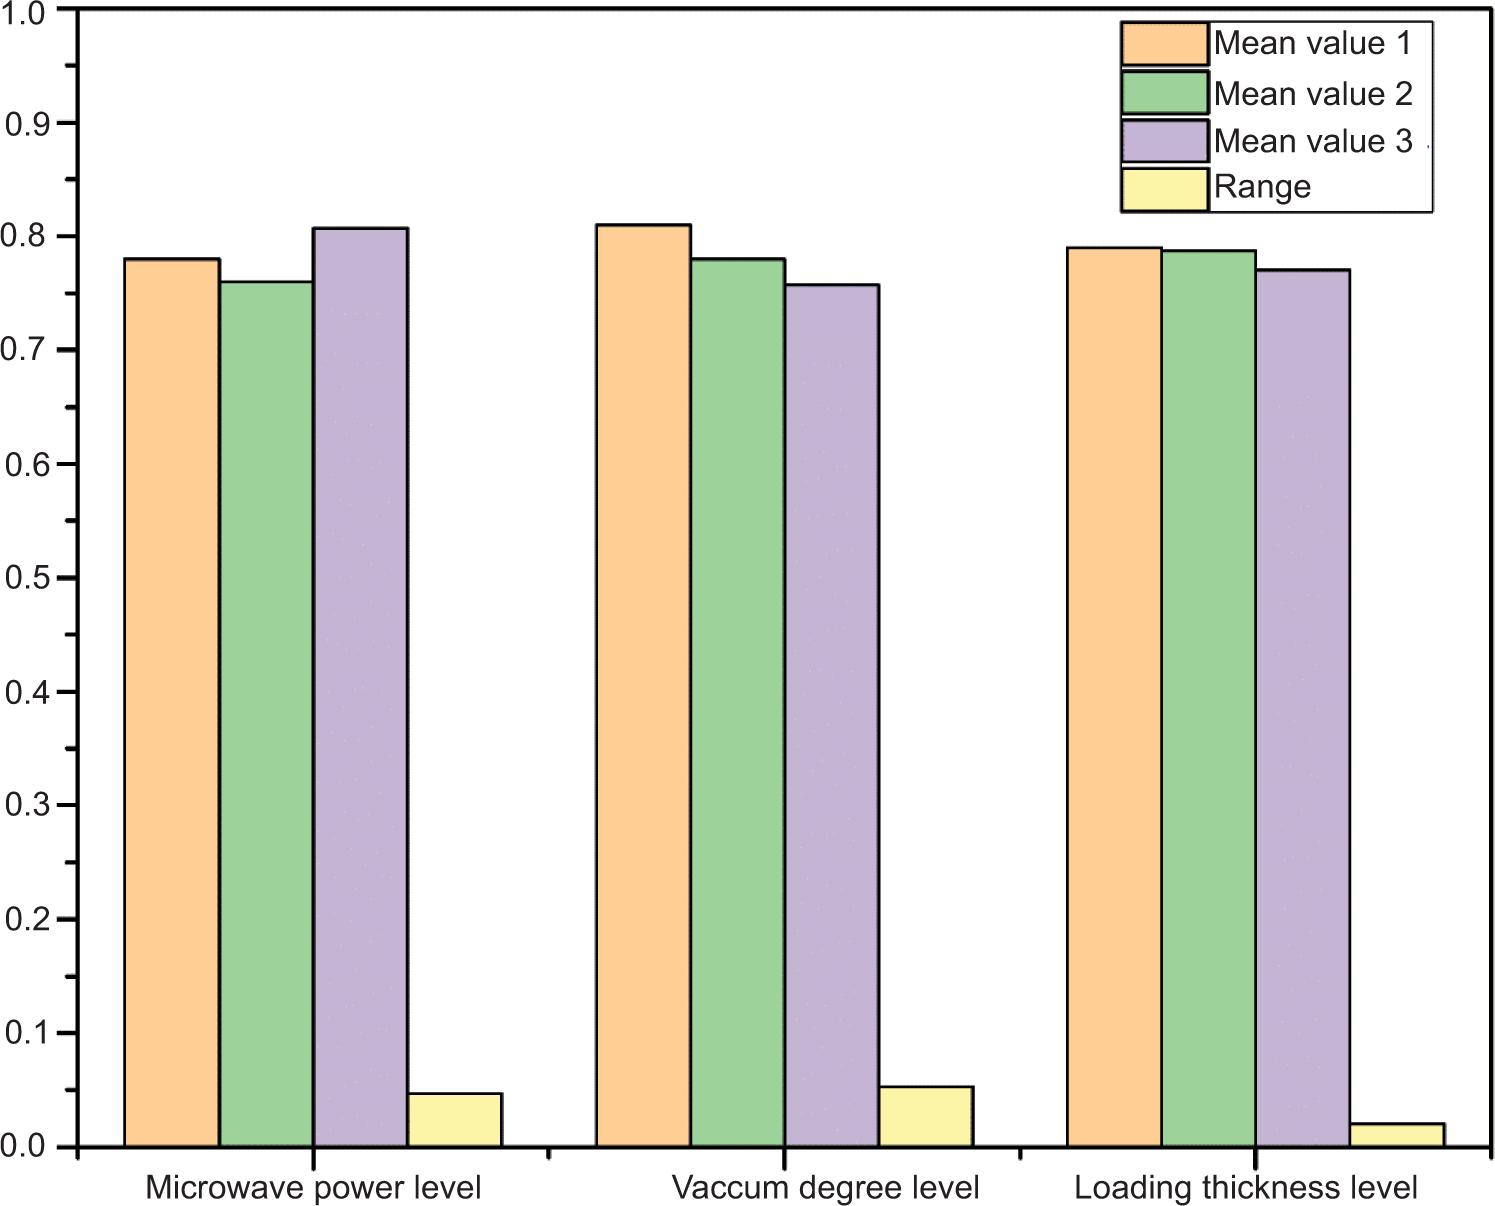
The average and range of the head rice rate are calculated according to the results of the orthogonal experiments (Deng et al., 2018; Guo et al., 2017). The calculated data are shown in Table 5, and the analytical histogram is presented in Figure 4. Table 5 and Figure 4 demonstrate that the range of the head rice at the vacuum level is 0.053, at the microwave power level is 0.047, and at the level of the loading thickness is 0.020. The vacuum degree has a great influence on the head rice rate, and that affected by the vacuum degree fluctuates from 75.7% to 81%. The microwave power has a second effect on the head rice rate, and that affected by microwave power fluctuates between 78% and 80.7%. The loading thickness has the least effect on the head rice rate, and that affected by the loading thickness fluctuates between 77% and 79%. The range of the head rice rate fluctuations under the influence of microwave power and the loading thickness is also small and stable, with a difference of only approximately 2%. During the microwave drying of rice, the percentage of the head rice should be high to preserve the nutritional value of rice. In terms of the head rice rate, the optimal conditions for microwave dry rice are as follows: the microwave power is 500 W, the vacuum degree is 0.02 MPa, and the loading thickness is 0.015 m.
Table 5. Orthogonal experimental analysis of the head rice rate.
| Serial no. | Microwave power level | Vacuum degree level | Loading density level | Percentage of head rice |
|---|---|---|---|---|
| 1 | 1 | 1 | 1 | 77% |
| 2 | 1 | 2 | 2 | 79% |
| 3 | 1 | 3 | 3 | 78% |
| 4 | 2 | 1 | 2 | 83% |
| 5 | 2 | 2 | 3 | 70% |
| 6 | 2 | 3 | 1 | 75% |
| 7 | 3 | 1 | 3 | 83% |
| 8 | 3 | 2 | 1 | 85% |
| 9 | 3 | 3 | 2 | 74% |
| Mean value 1 | 0.780 | 0.810 | 0.790 | |
| Mean value 2 | 0.760 | 0.780 | 0.787 | |
| Mean value 3 | 0.807 | 0.757 | 0.770 | |
| Range | 0.047 | 0.053 | 0.020 |
Figure 4. Columnar analysis of the head rice rate.
The variance calculation of the head rice rate is carried out according to the orthogonal experimental results (Deng et al., 2018; Guo et al., 2017). The analytical data given in Table 6 illustrate that the deviation quadratic sum of the head rice rate under different microwave power values is 0.003, that under various vacuum degrees is 0.004, and that under diverse loading thicknesses is 0.001. The degree of influence of the different factors on the head rice rate is sequenced as follows: vacuum degree > microwave power > loading thickness. The result is consistent with the range of analytical results.
Table 6. Variance analysis of the head rice rate.
| Factor | Quadratic sum of the deviation | Degrees of freedom | F ratio | F thresholds |
|---|---|---|---|---|
| Microwave power | 0.003 | 2 | 1.125 | 5.140 |
| Vacuum degree | 0.004 | 2 | 1.500 | 5.140 |
| Loading density | 0.001 | 2 | 0.375 | 5.140 |
| Error | 0.01 | 6 |
Process parameter optimization
The optimal combination of the parameters for the head rice rate is A3B1C1 (i.e., the microwave power is 500 W, the vacuum degree is 0.02 MPa, and the loading thickness is 0.015 m). The head rice rate is high under this process parameter, and the brown rice after threshing has mostly intact rice grains, but the crack rate of brown rice also increases, which is not the optimal situation. The optimal combination of parameters for the brown rice crack rate is A1B1C3 (i.e., the microwave power is 300 W, the vacuum degree is 0.02 MPa, and the loading thickness is 0.038 m). In this circumstance, the crack rate of the brown rice is low, but its head rice rate is reduced. These analyses are optimized for a single indicator. A set of parameter combinations must be determined; such combinations can consider the head rice and crack rates simultaneously, which can be realized by establishing the grey correlation model of the above-mentioned different factor levels to a single target (Jong et al., 2019). The grey correlation model can combine the head rice and crack rates into a single target as a comprehensive evaluation index and carry out the search for a single target to expect microwave drying of rice to achieve the optimal process (Chen et al., 2017).
The results of the nine sets of experimental data are treated as a grey system. The matrix is established using the head rice and crack rate data in the orthogonal experiment of the microwave drying of rice. When n = 1,
The reference data column is a relatively idealized optimal process sample and the standard of the comprehensive evaluation, which can be the best value (or the worst value) of each indicator to form a reference data column. Other reference values can also be selected according to the evaluation purposes. The reference number series recorded as follows:
According to the meaning of the two evaluation indicators of the head rice and crack rates, the maximum head rice rate and the minimum crack rate are regarded as the optimal values. The optimal values of the two indicators are selected in nine groups of experiments to form a reference series:
The initial value sequence is calculated on the basis of the non-dimensionalization of the original data matrix (Kong et al., 2018):
where, i is the number of the rows of the matrix, i = 1, 2; and j is the number of the columns of the matrix, j = 1, 2, …9.
The calculation result is expressed as follows:
We find the difference in the sequence:
where, α is the number of factors affecting microwave drying of rice, α = 1,2; and α indicates the number of microwave drying experiments, β = 1,2,…9.
The calculation result is expressed as follows:
The range between the indicators is (Sun et al., 2018):
According to equations (11) and (12), the largest element in the matrix is 0.15, and the smallest one is zero (i.e., M = 0.15 and m = 0).
The correlation coefficient between the crack and the head rice rates can be calculated from the following formula (Gong et al., 2019):
where, ρ is the resolution coefficient, generally selected within (0,1). If the resolution coefficient is small, then the difference between the correlation coefficients is large, and the distinguishing ability is strong. Generally, the resolution coefficient is 0.5.
The correlation coefficient between the crack and the head rice rates is calculated according to equation (13), and the result is shown in Table 7.
Table 7. Correlation coefficients of the influencing factors.
| Evaluation indicator | Serial no. | ||||||||
|---|---|---|---|---|---|---|---|---|---|
| 1 | 2 | 3 | 4 | 5 | 6 | 7 | 8 | 9 | |
| Head rice rate | 0.4839 | 0.5556 | 0.5172 | 0.7895 | 0.3333 | 0.4286 | 0.7895 | 1 | 0.4054 |
| Crack rate | 0.6579 | 0.8929 | 0.6696 | 0.6048 | 1 | 0.5682 | 0.9740 | 0.5208 | 0.4121 |
The correlation of the reference series is determined by nine correlation coefficients, and the grey correlation between the crack and the head rice rates is (Pagar and Gawande, 2020; Sun et al., 2018):
The grey correlation degree between the crack and the head rice rates is shown in Figure 5. The head rice rate fluctuates between 0.7 and 0.85. Meanwhile, the crack rate fluctuates between 0.14 and 0.25. In the first three sets of experiments, the values of the head rice and crack rates slightly fluctuated, and the curve was relatively flat. Later, the value of the head rice rate reaches the first peak and then rapidly decreases. This value reaches the minimum value of 0.70, slowly rises to the maximum value of 0.85, and then begins to decline. The crack rate slightly fluctuates, goes through three troughs and two peaks, fluctuates in the range of 0.15 to 0.20, and finally rises to a maximum of 0.25. In summary, the grey correlation curve significantly fluctuates and goes through three peaks and two troughs. Finally, the curve rapidly drops. The maximum grey correlation degree on the entire curve is 0.8817, and the minimum is 0.4087. The grey correlation degree greatly varies, but most values are above 0.5, thereby showing that the correlation between the head rice and the crack rates during microwave drying is relatively large. The optimal drying process can also consider the head rice and crack rates.
Figure 5. Grey correlation of the influencing factors.
The mean value and range can be obtained using the grey correlation value between the head rice and crack rates (Table 8). The result is good when the value of the grey correlation between the head rice and the crack rates is large. The experimental parameter with the highest average can be regarded as the optimal process parameter. The maximum average value of the correlation degree in the microwave power level is 0.684, in the vacuum level is 0.717, and in the loading thickness level is 0.701. The maximum average values of the correlation degree under the vacuum of 0.02 and 0.04 MPa are both 0.717. However, the increase in vacuum degree will lead to an increase in the head rice and crack rates simultaneously; thus, the vacuum degree is selected as 0.02 MPa. Under the given experiment, the optimal combination of microwave drying rice is A3B1C2 (i.e., microwave power of 500 W, vacuum degree of 0.02 MPa, and the loading thickness of 0.027 m). Although the head rice rate did not reach the maximum, and the crack rate did not reach the minimum under this process condition, both have been considered. Accordingly, the process parameter combination obtained by the grey correlation method has an improved effect, and the optimization of the results of orthogonal experiments has been achieved.
Table 8. Grey correlation analysis.
| Serial no. | Microwave power level | Vacuum degree level | Loading thickness level | Grey correlation |
|---|---|---|---|---|
| 1 | 1 | 1 | 1 | 0.5709 |
| 2 | 1 | 2 | 2 | 0.7242 |
| 3 | 1 | 3 | 3 | 0.5934 |
| 4 | 2 | 1 | 2 | 0.6972 |
| 5 | 2 | 2 | 3 | 0.6667 |
| 6 | 2 | 3 | 1 | 0.4984 |
| 7 | 3 | 1 | 3 | 0.8817 |
| 8 | 3 | 2 | 1 | 0.7604 |
| 9 | 3 | 3 | 2 | 0.4087 |
| Mean value 1 | 0.630 | 0.717 | 0.610 | |
| Mean value 2 | 0.621 | 0.717 | 0.701 | |
| Mean value 3 | 0.684 | 0.500 | 0.684 | |
| Range | 0.063 | 0.217 | 0.152 |
Conclusions
In this study, the experimental method of microwave drying of rice has been discussed. The process parameters were evaluated by the orthogonal experimental method from two indicators: crack and head rice rates. The result shows that the optimal process parameters under the two indicators were inconsistent, and the method could only be optimized for one indicator. The grey correlation analytical method was proposed. The grey correlation degrees of the crack and head rice rates under the different loading thicknesses, microwave powers, and vacuum degrees were calculated. The experimental parameters with the maximum average value of the correlation degree were taken as the optimal process parameters, considering the head rice and crack rate. The optimum technology is microwave power of 500 W, vacuum degree of 0.02MPa, and loading thickness of 0.027 m. The optimizations of head rice rate and crack rate are considered simultaneously. The drying effect using the parameters is better than that considering only the optimization of a single index, and it is also a further optimization of orthogonal experiment results.
Conflicts of Interest
No potential conflict of interest was reported by the authors.
Funding
This work is supported by the Scientific Research Project of the Education Department of Anhui Province (No. KJ2020ZD38).
REFERENCES
Abbaspour-Gilandeh Y, Kaveh M, Jahanbakhshi A. The effect of microwave and convective dryer with ultrasound pre-treatment on drying and quality properties of walnut kernel. J Food Process Preserv. 2019;43:14178. 10.1111/jfpp.14178
Barreto I, Tribuzi G, Marsaioli Junior A, Carciofi B, Laurindo JB. Oil–free potato chips produced by microwave multiflash drying. J Food Eng. 2019;261:133–9. 10.1016/j.jfoodeng.2019.05.033
Chen M, Ding Y, Wu D, Ma L, Chen Y, Liu Y, et al. Grey relational analysis of contaminants governing foaming behavior in desulfurization solution for high-sulfur natural gas. Pet Sci Technol. 2017;35(24):2249–54. 10.1080/10916466.2017.1396611
Deng L, Feng B, Zhang Y. An optimization method for multi-objective and multi-factor designing of a ceramic slurry: combining orthogonal experimental design with artificial neural networks. Ceram Int. 2018;44(13):15918–23. 10.1016/j.ceramint.2018.06.010
Ding S, Dang Y, Xu N, Wang J. Multivariable grey forecasting model based on interaction effect and its application. J Syst Eng Electron. 2018;40(03):595–602. 10.3969/j.issn.1001-506X.2018.03.17
Gao C, Li S, Wang J, Li L, Lin P. The risk assessment of tunnels based on grey correlation and entropy weight method. Geotech Geol Eng. 2018;36(03):1621–31. 10.1007/s10706-017-0415-5
Gong X, Yin C, Li X. A grey correlation based supply–demand matching of machine tools with multiple quality factors in cloud manufacturing environment. J Ambient Intell Humaniz Comput. 2019;10(03):1025–38. 10.1007/s12652-018-0945-6
Guo S, Zhou X, Song S, Mei Y, Zhao J, Fang Y. Optimization of leaching conditions for removing sodium from sodium-rich coals by orthogonal experiments. Fuel. 2017;208:499–507. 10.1016/j.fuel.2017.07.032
Jahanbakhshi A, Kaveh M, Taghinezhad E, Sharabiani VR. Assessment of kinetics, effective moisture diffusivity, specific energy consumption, shrinkage, and color in the pistachio kernel drying process in microwave drying with ultrasonic pretreatment. J Food Process Preserv. 2020;44(6):14449. 10.1111/jfpp.14449
Jiang J, Jin X, Mao Z, Sun Y, Zhou Q. Modeling and moisture content prediction of vacuum pulsating drying of paddy rice. Chinese J Vac Sci Technol. 2019;39(05):367–73. 10.13922/j.cnki.cjovst.2019.05.02
Jong J, Rim C, Choi M, Om H. Comprehensive evaluation of marine waste heat recovery technologies based on Hierarchy-Grey correlation analysis. J Ocean Eng Sci. 2019;4(04):308–16. 10.1016/j.joes.2019.05.006
Khan MH, Welsh Z, Gu Y, Karim MA, Bhandari B. Modelling of simultaneous heat and mass transfer considering the spatial distribution of air velocity during intermittent microwave convective drying. Int J Heat Mass Transfer. 2020;153:119668. 10.1016/j.ijheatmasstransfer.2020.119668
Kong L, Fang J, Wu Z, Zhang B. Evaluation of the effect of surface coatings on protection of concrete against sewage-induced degradation based on gray correlation analysis. J Coat Technol Res. 2018;15(06):1311–23. 10.1007/s11998-018-0079-y
Li C, Zhang J, Yu W. Progressive orthogonal optimization design method for high efficiency axial-flow blower. Int J Fluid Mach Syst. 2018a;11(04):412–23. 10.5293/IJFMS.2018.11.4.412
Li L, Zhang M, Bhandari B, Zhou L. LF-NMR online detection of water dynamics in apple cubes during microwave vacuum drying. Drying Technol. 2018b;36(16): 2006–15. 10.1080/07373937.2018.1432643
Liu S, Li Z, Li Y, Cao W. Strength properties of Bayer red mud stabilized by lime-fly ash using orthogonal experiments. Constr Build Mater. 2018;166:554–63. 10.1016/j.conbuildmat.2018.01.186
Luo C, Tang Z, Cheng J, Shi J, Kan Ln, Zhang Z, et al. Current status of rice drying using microwave drying technology and drying test research on continuous microwave dryer. Farm Prod Process 2020;2(03):74–7+80. 10.16693/j.cnki.1671-9646(X).2020.02.019
Pagar N D, Gawande SH. Parametric design analysis of meridional deflection stresses in metal expansion bellows using gray relational grade. J Braz Soc Mech Sci Eng. 2020;42(05):256. 10.1007/s40430-020-02327-0
Shinde Anil B, Pawar Prashant M. Multi-objective optimization of surface textured journal bearing by Taguchi based Grey relational analysis. Tribology Int. 2017;114:349–57. 10.1016/j.triboint.2017.04.041
Song S, Wang M. Microwave drying characteristics and kinetic model of cooked purple sweet potato slice. Food Ferment Ind 2020;46(02):85–93. 10.13995/j.cnki.11-1802/ts.021979
Sun G, Guan X, Yi X, Zhou Z. Multi-attribute decision making with interval-valued hesitant fuzzy information, a novel synthetic grey relational degree method. Informatica (Netherlands). 2018;29(03):517–37. 10.15388/Informatica.2018.179
Sun W, Li D, Liu P. A decision-making method for Sponge City design based on grey correlation degree and TOPSIS method. J Interdiscip Math. 2018;21(04):1031–42. 10.1080/09720502.2018.1456826
Taheri S, Brodie G, Gupta D. Microwave fluidised bed drying of red lentil seeds: drying kinetics and reduction of botrytis grey mold pathogen. Food Bioprod Process. 2020;119:390–401. 10.1016/j.fbp.2019.11.001
Tang H, Deng W, Sun Z, Wang Y, Li L, Ding Y, et al. Optimization of factors influencing temperature rise and thermal necrosis of a robot driven piezoelectric osteotomy in bovine cortical bone: an in vitro study using an orthogonal test design. Clin Biomech. 2019;70:249–56. 10.1016/j.clinbiomech.2019.10.013
Xie N, Chen N. Flexible job shop scheduling problem with interval grey processing time. Appl Soft Comput J. 2018;70:513–24. 10.1016/j.asoc.2018.06.004
Xie N, Xin J. Interval grey numbers based multi-attribute decision making method for supplier selection. Kybernetes. 2014;43(7):1064–78. 10.1108/K-01-2014-0010
Yang Y, Li X, Tang K. Orthogonal array design tests for optimizing ultrasonic-microwave synergistic extraction of Cinnamomum petrophilum leaves oil. J Cent South Univ Technol. 2016;36(11):125–8+136. 10.14067/j.cnki.1673-923x.2016.11.022
Yuan J, Zhao T, Ding C, Xing C, Zhang B, Cheng S, et al. Effects of microwave treatments on rice quality and lipase activity. Sci Agricultura Sinica. 2018;51(21):4131–42. 10.3864/j.issn.0578-1752.2018.21.011
Zhang J, Meng G, Peng G, Zhang X, Yang L. Optimization of process parameters for hot air and vacuum combined drying for rice. Food Fermentation Indust. 2019;45(18):155–61. 10.13995/j.cnki.11-1802/ts.020875
Zhang Y, Jia Y, Li M, Hou L. Spatiotemporal variations and relationship of PM and gaseous pollutants based on gray correlation analysis. J Environ Sci Health A. 2018;53(02):139–45. 10.1080/10934529.2017.1383122
Zheng X, Xu H, Wang F, Liu H. Simulation analysis and verification of flow field in continuous microwave dryer. J Northeast Agric Univ. 2018;49(09):69–78+87. 10.19720/j.cnki.issn.1005-9369.2018.09.009
Zhou H, Li Z, Li J, Li L, Xu W. Research on microwave drying process of carrot under different humidity. J Food Sci Biotechnol. 2019;38(05):58–65. 10.3969/j.issn.1673-1689.2019.05.009